Short answer: Not very!
<<Note to readers: highly recommended to read Post #3 before this one.>>
The short answer comes from a quantitative analysis of 231 exact red wines reviewed by all three platforms: Wine Spectator (WE), Wine Enthusiast (WE) and Vivino (V). Of the 231 wines, only six (!) were given the same scores by all three platforms. But exact matches on three different platforms is an unreasonable expectation. To start with, two platforms (WS, WE) feature expert reviewers, who have all dedicated a significant share of their lives to tasting and evaluating wines. I’ve seen more than one expert reviewer argue that they can and do give good reviews and high scores to wines they don’t actually like, but in objective terms are good or even great wines. I take that claim with a grain of salt, but it’s an admirable goal and I hope they take it seriously. I believe wholeheartedly that even the expert reviewers bring their own preferences to the table, so it is expected that some variation in scores would occur. As a social network with a largely unknown group of reviewers, V reviews are by definition almost entirely non-experts, with unknown standards and talents. I didn’t expect V reviews to correlate very well with the expert reviews, and my hypothesis coming in was that WS and WE would correlate fairly well. How wrong I was!
A few words about the 231-wine sample: My interest was to identify bias in scores for “splurge” wines, which for me are wines in the $30 to $100 range. I buy a few dozen wines like that a year, and being an amateur, I’m ignorant about most of those wines. I use scores and reviews to help me make “buy” decisions (see Post #3 for more on this). Sometimes high-scoring wines turned out to be a disappointment, and my main interest in this analysis is to suss out any systematic bias towards higher scores in the platforms I use. So my sample is biased toward wines in the $30 to $100 range (though I included wines at lower and higher prices, too), and toward wines with higher scores on at least one platform.
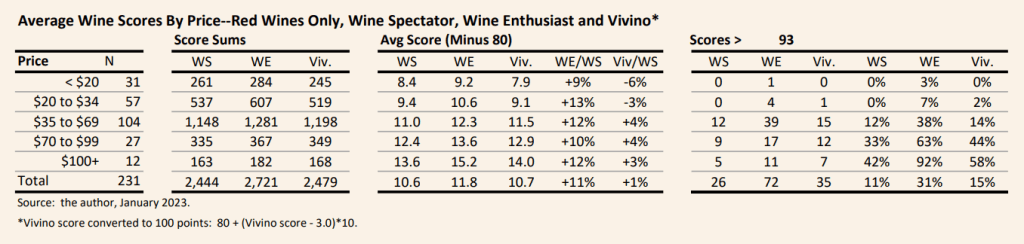
I started with some basic statistics on scores for the 231 wine sample, shown in the table below. Reassuringly (or, maybe not!) scores tended to increase with price, on average, on all three platforms. Note that I compared average score on the 100 point scale minus 80, mainly because almost no wines get scores lower than 80 on any of the three platforms. Also, I converted the Vivino 5-point scale to 100 points (V100–see Post #3 for more details on that conversion, too).
- WE scores were 11% higher than WS scores, on average.
- V100 scores were almost identical to WS, on average.
- WE was three times more likely to score a wine 94+ points than WS. WE scored nearly one-third of the sample at 94+ points, compared to one-in-10 for WS and one-in-7 for V100.
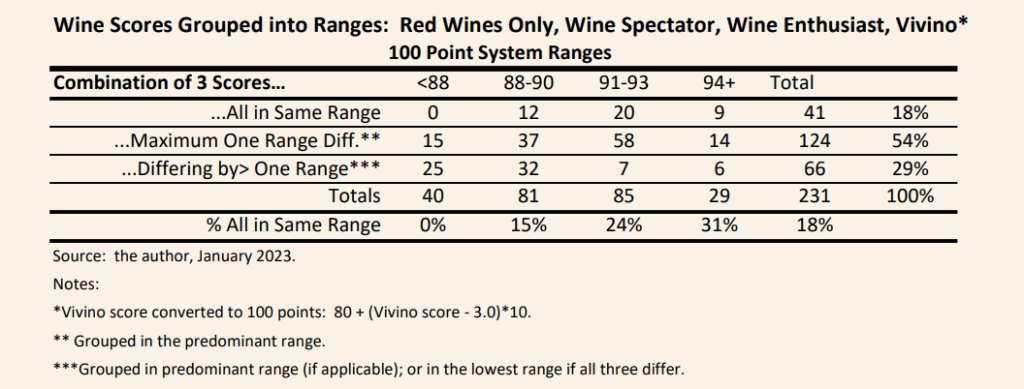
Another way to look at consistency is to group the wines into score ranges, and assess how consistently wines are scored into common ranges. This solves the “exact match” problem, and provides a broader definition of consistency. Scores were grouped into four categories: less than 88 points; 88 to 90 points; 91 to 93 points; and 94+ points. Turns out, even broadening the matching of scores to these broader categories does not do much to show consistency between scores given to wines.
- About one-in-five (18 percent) of the 231 wines were scored into the same group in all three platforms.
- Over half of the wines had differences of one range amongst the three platforms.
- Almost one third (29 pecent) of wines had differences of more than one range amongst the three platforms. E.g. a wine given a rating of 85 in one platform was given 92 in another, or a wine given 89 in one platform was given 95 in another.
- On the plus side: more consistency was shown for wines scored 94+ points, with about one-third of wines so-rated in all three platforms. Still, as a consumer wanting to avoid paying a premium price for a highly rated wine, knowing that two-thirds of those wines were judged signficantly lower by at least one platform does not inspire much confidence.
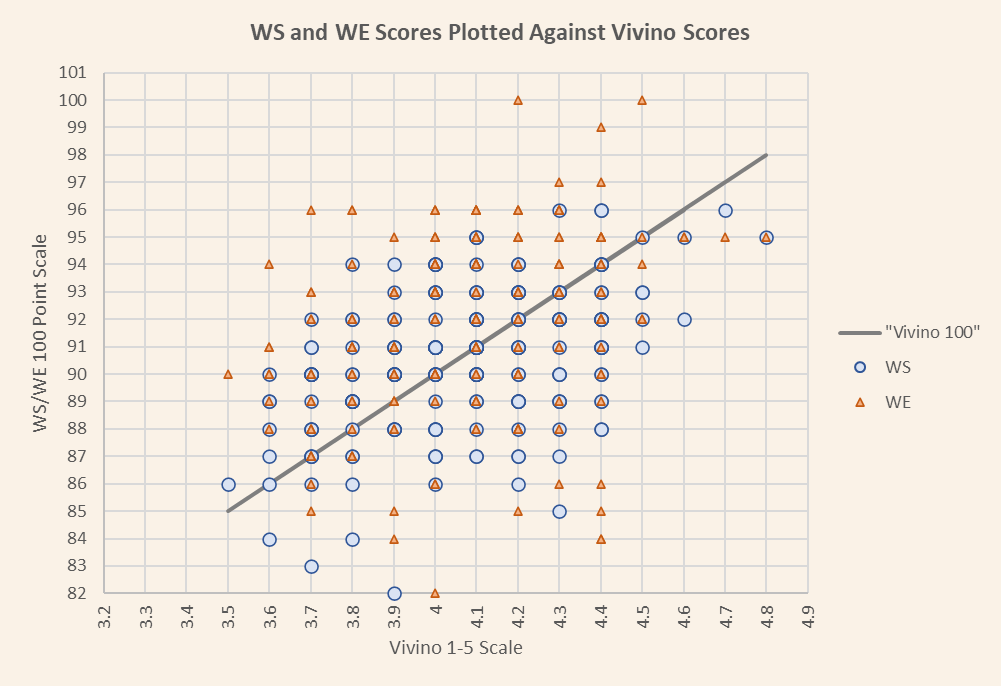
A final way to look at consistency is to “scatterplot” the 231 wines graphically. Using the Vivino score as a reference, I plotted WS and WE scores (see figure below). If the scores were consistent to the Vivino reference, the dots representing WS and WE would cluster around the line in the graph. In fact, they are scattered in a cloud around the line, illustrating the differences between the scores.
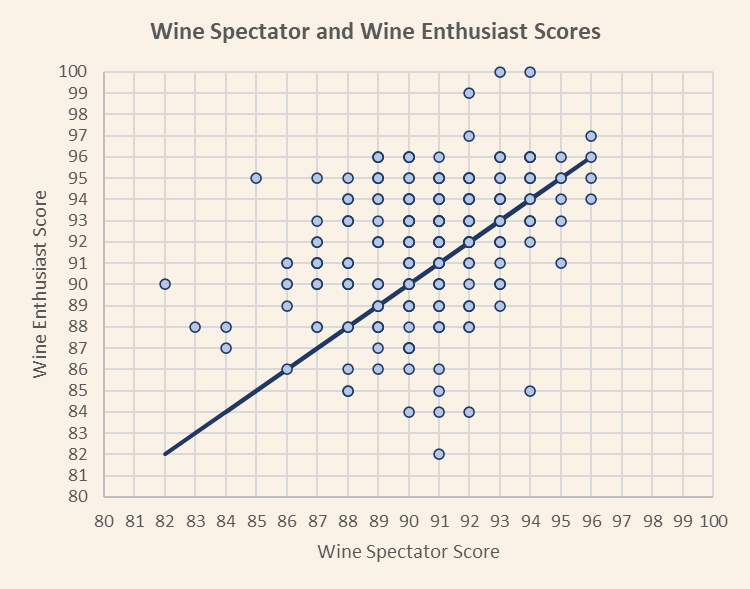
Given that WS and WE are expert scoring platforms, and Vivino is a social network with explicitly non-expert scorers, WS and WE should be more consistent to each other. The figure below takes Vivino out of the mix, and illustrates the differences between WS and WE for the 231 wines. Again, consistent scores would cluster around the line, but the scores are scattered in a cloud around the wine. In fact, the average difference in scores between WS and WE is 2.6 points. WS is actually more consistent with Vivino than with WE, with an average difference of 2.0 points.
Takeaways:
- Wine scores among the three platforms I looked at were not just inconsistent–they were massively so. A consumer has no real reason to assume that a highly score wine on one platform will score highly on another of the three.
- Counter to my expectation, the inconsistencies between the two expert platforms (WS and WE) were larger than those between at least one of the platforms (WS) and the social network platform (Vivino).
This analysis left me with a big curiosity about the reviewers in the expert platforms, and whether the inconsistencies between the platforms is created more by individual reviewers. Post #5 dives into this question.
